Why delivery reporting must move beyond activity tracking

Traditional reports list what a team did. Our Value Delivery Reports go beyond activity. They give you ultimate visibility into value created, project health, risks, and next steps.
TL;DR | |
What a VDR is | A decision-oriented delivery report. It shows how engineering investment is converting into production progress and business value. |
Who it's for | Product leaders, engineering managers, and executives responsible for technology investment. |
How often it's sent | Every two weeks, aligned with the delivery cycle. |
Why it matters | It changes the conversation from What did the team do? to What changed, what value did it create, and what should we do next? |
There's a moment that happens in almost every client relationship, usually a few months in. The client asks something simple, like "so what actually happened this sprint?", and gets a status call in return. Nobody lied, but nobody actually answered the question either. The call ends, the client hangs up a little more anxious than before, and nobody can quite say why.
That gap is where most delivery reporting quietly fails. It tells you the team was busy. It doesn't tell you whether busy turned into anything worth paying for.
We built the Value Delivery Report (VDR) to close that gap. It answers the questions every software leader eventually asks:
Are we making meaningful progress?
What could put our roadmap at risk?
Where should we invest next?
Here's how VDRs turn delivery updates into better business decisions.
The sourcing model is changing—reporting has to follow
For years, buying software delivery was easy to describe. A client needed engineering capacity. A vendor supplied developers, QA engineers, DevOps specialists, or a whole team. And reporting followed the same logic capacity: tasks completed, hours spent, sprint velocity, milestones reached.
That answers an operational question: was the team busy, and did it execute the plan? It doesn't answer the business question: did the investment create meaningful progress?
That distinction is getting harder to ignore. Research across the technology services market—Deloitte's outsourcing survey, ISG's index, Gartner's research on custom software—all point in the same direction. Clients increasingly hire partners for specialized capability, agility, and business outcomes.
DORA's software delivery research adds another layer. How quickly and reliably software reaches production isn't just an engineering detail anymore. It determines how fast an investment can produce feedback, and eventually, value.
Put together, the shift isn't simply "time and materials becomes fixed price." It runs deeper:
capacity → capability → managed responsibility → outcomes
If clients are buying outcomes, a vendor can't keep reporting on activity alone.
The problem with the old way of reporting
Traditional project reporting has a valid purpose. It communicates health, progress, risks, blockers, and open questions. The trouble starts when the status report becomes the definition of delivery success.
A team can look great on paper and still create very little business value. For example, a team can be:
100% allocated,
hitting every sprint commitment,
closing dozens of tickets,
staying within budget.
And still deliver almost nothing that matters to the business. Here's what that gap actually looks like in practice:
A feature is technically complete, but not yet in production.
A release reaches production, but sees almost no adoption.
A team ships more tickets, while cycle time quietly gets worse.
A product looks stable, simply because most engineering capacity is going into maintenance instead of new value.
None of that shows up in a simple green/amber/red status update. It creates a dangerous gap between delivery activity and investment performance. The client sees motion. What they need is evidence of movement.
What is a Value Delivery Report?
A VDR comes out every two weeks. It focuses on the value delta since the last cycle. What's actually different now compared to two weeks ago.
A traditional status update might say:
The new analytics feature was completed.
A VDR goes further:
The analytics capability went live in production. Lead time dropped during the release cycle. No issues were reopened after QA. Adoption grew from 15 to 40 users in the first two weeks. The next decision is whether to expand the capability to the second user group.
The first statement reports output. The second gives you evidence for an investment decision. That distinction matters more as clients move toward shorter investment cycles, working through a loop like this:
Invest → Deliver → Production → Measure → Decide
The VDR is what supplies the evidence at the Measure → Decide point.
Anatomy of a VDR
Each section answers a different management question.
Section | Question it answers |
Executive Summary | What materially changed during the last two weeks? |
VCM Metrics Over Time | How did speed, quality, and impact move? |
Story Behind the Numbers | Why did those metrics change? |
Value Delta | What capability, improvement, risk reduction, or adoption change now exists that didn’t exist before? |
Focus Highlight | What’s the most important delivery signal this cycle? |
Risks & Decision Points | What decision is needed, by whom, and by when? |
A VDR doesn't have to be positive. If cycle time gets worse, we show it. If defects went up, we explain why. If a feature went live but adoption stayed low, that's a value signal too.
A permanently optimistic report eventually stops being trusted. A VDR isn't there to prove everything is going well. It's there to make the true direction of delivery visible early enough to actually do something about it.
From tracking output to owning outcomes
This shift changed how we think about delivery management internally. We used to ask only: did we deliver what we planned? Now we also ask: what changed because we delivered it?
That means looking at delivery across three dimensions:
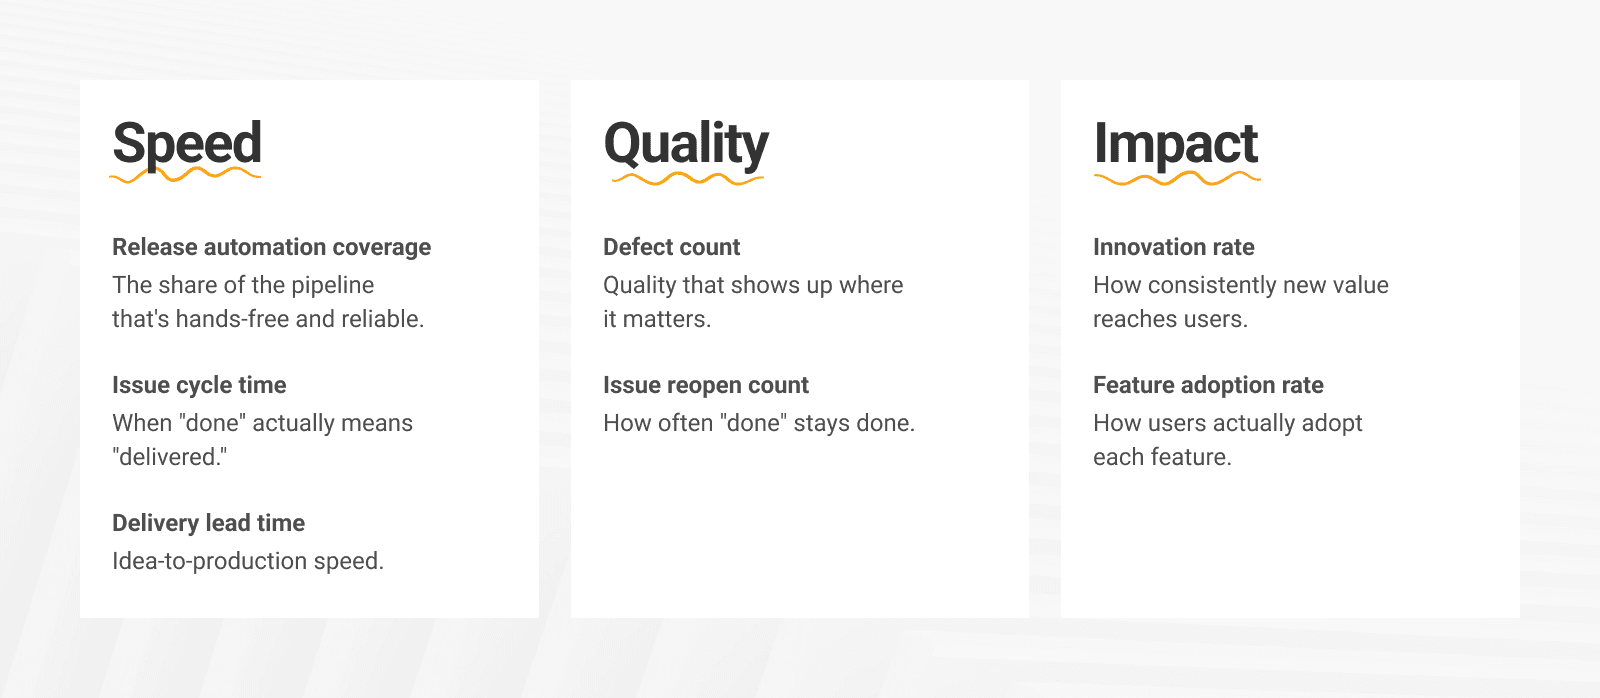
Speed — how quickly value moves through the engineering system and reaches production.
Quality — whether that speed creates reliability, or simply pushes defects downstream.
Impact — whether the capability being built creates new value, and whether users actually adopt it.
Together, these form our Value Creation Metrics, or VCM. The metrics provide the signal. The VDR explains what that signal means and what should happen next.
Speed: how quickly investment reaches production
DORA's research helped make lead time a central measure of engineering performance. The idea behind it is simple: Finished code that's waiting to be released hasn't created any user value yet.
That's why our speed metrics track two things:
Issue cycle time—how efficiently work moves through development.
Delivery lead time—how quickly completed work actually reaches production.
The distinction matters. A team can code fast and still run a slow delivery system. Common causes include:
long reviews,
manual regression,
environment bottlenecks,
large release batches,
approval delays,
deployment dependencies.
When lead time drops, the feedback loop gets shorter. And the shorter that loop gets, the sooner a client can tell whether the investment is working. That's the connection between engineering velocity and time-to-value.
Real case
In one recent reporting cycle, cycle time dropped from 8.3 days to 6.5 days. The number itself was useful. But the more important question was why.
The change came down to three things: less rework, clearer AI-assisted workflows, and fewer restarts caused by shifting requirements.
So the VDR didn't just say "cycle time improved by 1.8 days." It said: delivery got faster because specific sources of friction were removed. That makes the improvement more likely to stick. It's a management signal, not just a dashboard statistic.
Quality: speed without hidden debt
Faster delivery only matters if the software stays trustworthy. That's why we read speed and quality together. We track:
defect count,
reopen count,
release automation coverage.
A rising reopen rate is especially telling. It shows when work that looked complete wasn't actually ready. In practice, that means the organization paid for the same unit of work more than once.
From a delivery angle, that's rework.
From a business angle, it's wasted investment.
A team whose cycle time improves while reopens climb may not be getting more effective at all. It may simply be pushing incomplete work through the system faster. A VDR makes that trade-off visible.
Impact: did engineering activity create something useful?
Speed and quality still don't answer the full question. Software can be delivered quickly and reliably and still create little value. That's what the third dimension, Impact, is for. We track:
Innovation rate
How much engineering capacity goes toward new or improved capabilities versus just keeping existing ones running. It answers: are we still moving the product forward, or increasingly just paying to keep it alive?
Feature adoption rate
How many intended users, teams, systems, or workflows actually use a newly delivered capability. It closes a real gap in traditional project reporting: release isn't the end of value creation; it's where value creation starts to get validated.
A feature that reaches production but goes unused isn't automatically a success. It's a signal that something else needs looking into, such as:
Was the wrong problem solved?
Is onboarding too hard?
Is awareness low?
Is the workflow poorly designed?
Was the original value hypothesis just wrong?
This is why VDRs keep pushing the delivery conversation beyond "did we ship it?" toward "did it matter?"
Measuring value delta
The central idea behind a VDR is the value delta. It asks one plain question: what's materially different from two weeks ago?
A positive value delta might look like:
A capability that didn't exist before is now live in production.
Delivery lead time went down.
Fewer defects are reaching later stages.
Deployment automation improved.
More users are adopting a new feature.
A real technical or compliance risk got removed.
A manual workflow is now running on its own.
A negative delta is just as valuable as information:
Delivery slowed.
Defect rates rose.
A dependency threatens the next release.
Production adoption is weak.
Maintenance work is eating a growing share of capacity.
The goal was never to manufacture a positive story. It's to catch movement early.
Real case
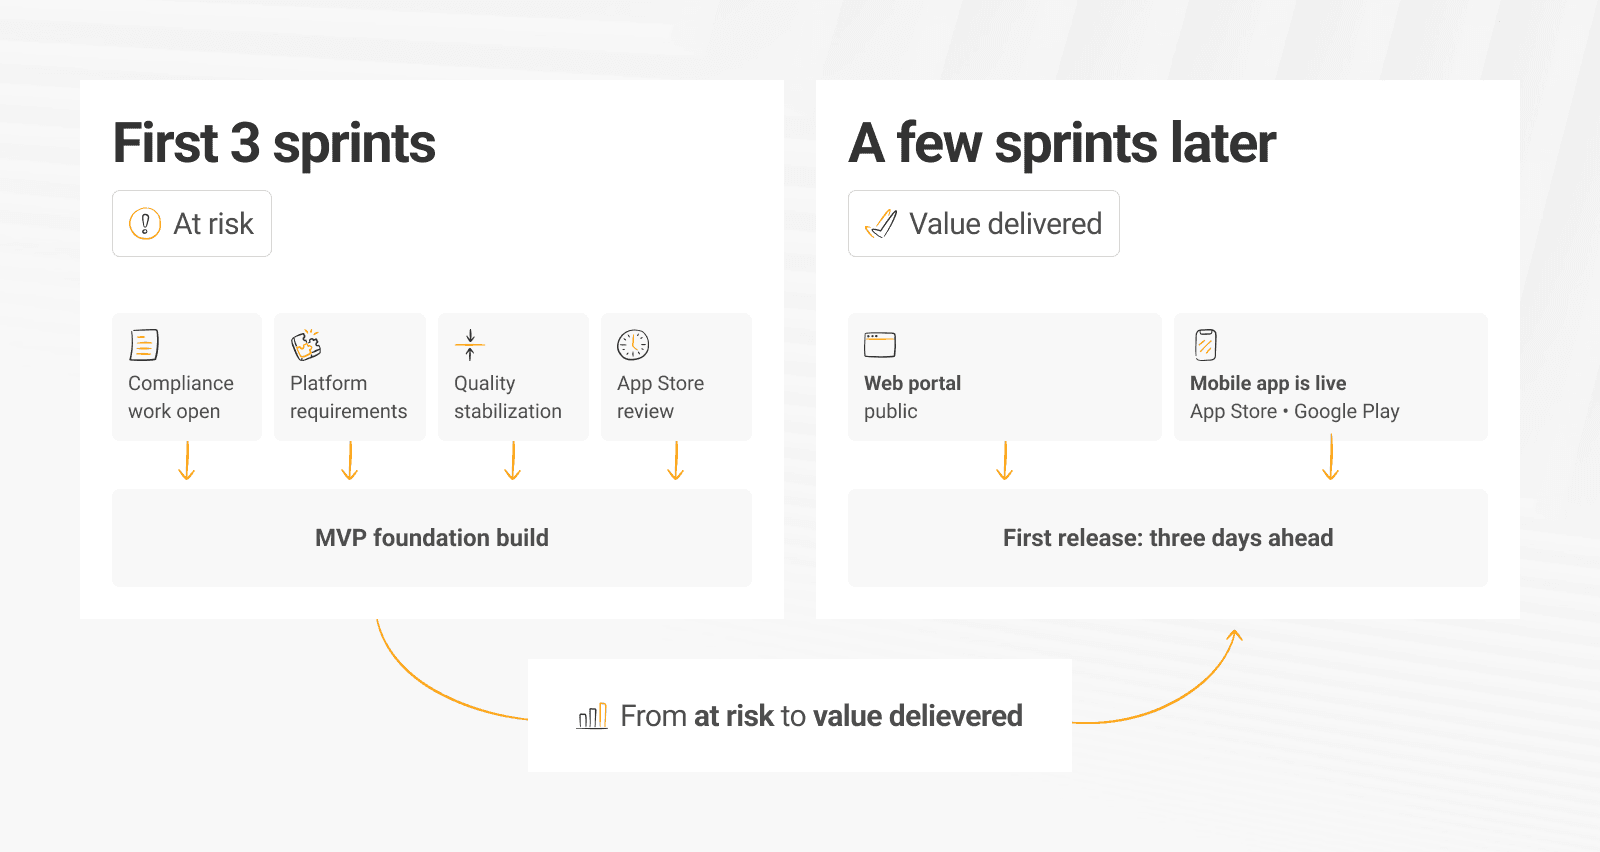
First three sprints: the project sat in the "At risk" category. Not a comfortable place for anyone to be. The core MVP foundation was built, but compliance work, quality stabilization, unresolved platform requirements, and App Store review all left submission readiness genuinely uncertain.
A few sprints later: the picture had changed completely. The mobile app was live on the App Store and Google Play, its web portal was public, and the first production release had shipped three days ahead of the committed date.
That's the difference between reporting output and showing value movement. And it's the difference between a client who's still holding their breath and one who can finally exhale.
A closer look: Sportstech project, VDR by VDR
The example above shows the shape of a value delta. What it doesn't show is how the three VCM categories actually move together, or how messy that middle stretch usually is.
Five real reporting cycles from one of our active clients show it clearly. It's a youth-sports recruiting platform, but the pattern underneath is the same one healthcare clients live through every release.
Period | Key shift | What it meant |
Apr 27 – May 10 | Steady cycle time, normal QA rhythm | Team progressing toward the planned launch |
May 11 – May 27 | Stable cycle time and normal QA rhythm | A late Apple/Google pricing requirement forced subscription rework without a quality collapse |
May 28 – Jun 10 | Cycle time rose, reopens fell | Larger interdependent features took longer, but completed work remained stable |
Jun 11 – Jun 25 | Throughput nearly tripled, reopens hit zero | High-pressure launch execution increased output without generating reopen debt |
Jul 17 – Jul 30 | Scope volatility down ~74% | Delivery became significantly more predictable |
The launch cycle is the most revealing one. Throughput increased sharply, defects rose right along with it under release pressure, but reopens stayed at zero.
Look at any single metric on its own, and you'd draw the wrong conclusion:
High defects on their own could look bad.
High throughput on its own could look great.
Zero reopens on its own could also look great.
Only reading the three together tells the real story. The team compressed release execution. They caught more defects during an intensified QA period. They fixed those defects. And none of it turned into downstream reopen debt. That's the difference between metrics and delivery intelligence.
Why this matters in shorter investment cycles
This gets more important as software delivery shifts toward smaller, more bounded investment decisions. BCG's research on digital transformation has repeatedly shown how hard large transformation programs are to pull off. One implication: committing large budgets for long stretches, before value can be validated, is a real risk.
Modern product engineering increasingly favors a shorter loop instead:
Business problem → Bounded investment → Working capability → Production → Usage and delivery evidence → Continue / adjust / stop
The smaller that loop gets, the less time a client waits to learn whether an investment is actually creating value. But a shorter cycle only works if decision-makers have reliable evidence to act on. That's one of the roles the VDR plays. It stops being just project reporting and becomes part of investment governance.
VDR as a shared decision system
A VDR gives the client and delivery team one consistent view of the engagement.
Better alignment | The real state of delivery no longer needs to be reconstructed from Jira, Slack, status meetings, and separate executive updates. |
Faster decisions | Decision points show up on a predictable two-week cadence, instead of waiting for an escalation. |
Smarter prioritization | Changes in speed, quality, impact, and adoption show where management attention should move next. |
Fewer surprises | Risks become visible while there's still time to change scope, sequencing, architecture, staffing, or investment. |
VDR and the changing vendor relationship
This is where delivery reporting connects to the broader sourcing trend.
The old relationship:
Client owns the problem and backlog.
Vendor supplies capacity.
Reporting proves utilization and execution.
The emerging model:
Client defines a business problem.
Vendor brings capability and engineering leverage.
Both sides define the desired outcome.
The vendor helps move it into production.
Evidence determines the next investment.
This does not mean staff augmentation or T&M disappears. Persistent product teams still make sense wherever roadmaps keep changing, and the client wants direct control over prioritization.
But another category of work is becoming genuinely attractive: short, bounded, production-oriented engagements. In those, clients aren't primarily buying hours. They're buying a faster route from problem to production to evidence.
If that's what the client is buying, a VDR becomes a natural part of the commercial model. It shows whether the investment is actually moving toward the outcome that was promised.
How VDR fits into our delivery system
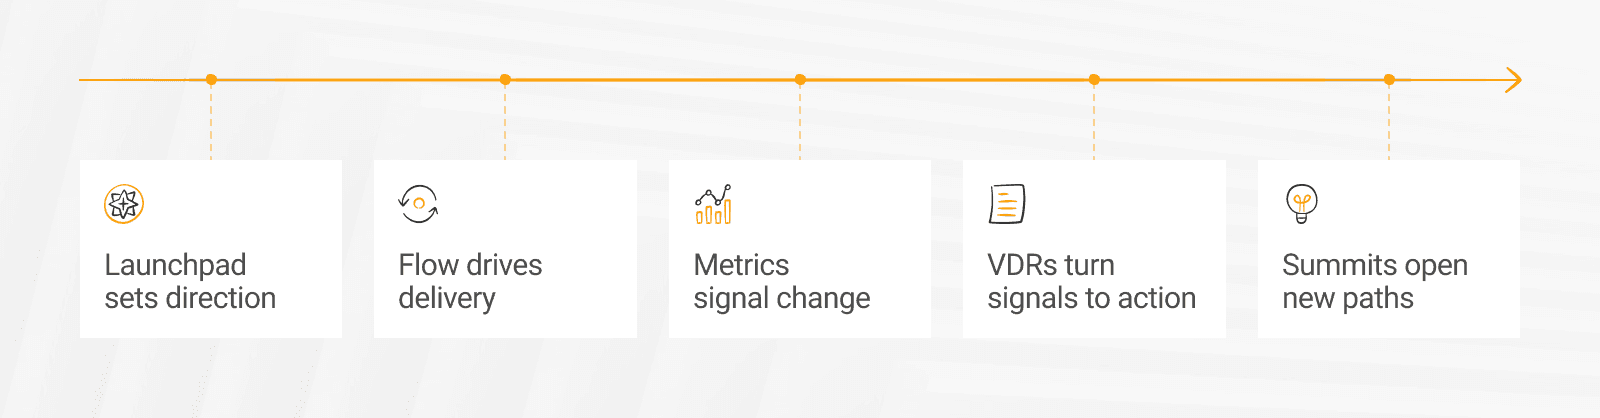
A VDR is one piece of a larger delivery system. Our Value Creation Culture sets the standard that delivery is measured by value.
Launchpad defines the problem, direction, and initial outcome..
Flow turns that direction into continuous delivery.
Value Creation Metrics measure speed, quality, and impact.
VDRs interpret those signals into business meaning and decisions.
Innovation Summits keep the system open to something better.
VDR vs. standard status update
Typical status report | Value Delivery Report |
What happened? | What changed? |
Tasks | Outcomes |
Activity | Value Delta |
Problems | Signals |
Release completed | Production impact |
Status | Evidence |
Past | Next decision |
Team execution | Investment performance |
The bigger question
The technology services market is gradually changing what it expects from a vendor. Being able to supply qualified engineers still matters. But engineering capacity alone is becoming less and less of a differentiator.
The stronger question is: how quickly can this partner turn our investment into a reliable production capability? And then: can they prove that capability is actually creating value? That's why we believe delivery reporting needs to evolve too.
A client should not have to ask: “So what actually happened this sprint?” They should already know:
what changed,
how quickly it moved,
whether quality held,
what reached production,
whether the product is being used,
where the risk is,
and what investment decision comes next.
That's what a Value Delivery Report is built to give you. Not more reporting—better evidence for better decisions.
Want to see what this level of delivery visibility could look like on your project? Let's talk.
FAQ
What is the purpose of a Value Delivery Report?
Its purpose: to make value creation, delivery health, and risk visible, so both sides can act before small issues turn into big ones.
How is a VDR different from a project status report?
A traditional project status report focuses on activities and progress. Rather than reporting activity alone, a VDR helps understand whether delivery is moving in the right direction and what should change if it isn't.
Who receives a Value Delivery Report?
A VDR is intended for both delivery teams and client stakeholders. It’s written in simple language, so even non-technical people would understand it.
How often do we create Value Delivery Reports?
VDRs are typically created every two weeks, aligning with the team's delivery cadence and sprint cycle.
What metrics should a Value Delivery Report include?
A VDR should include metrics that help evaluate delivery across impact, speed, and quality, rather than relying on a single productivity metric.
Why do clients benefit from Value Delivery Reports?
A VDR's real job is cutting down surprises. Catch trends, risks, and opportunities early, and clients can act before they turn into costly delays or missed milestones. Delivery gets more predictable and a lot more collaborative.

Share post